As house prices are predicted to rise steadily through 2022, property investment looks set to continue being a popular choice for many. The current average rental yield for the UK is 3.63%, however, savvy investors know that much greater returns can be had in certain locations, but where?
At Track Capital we have analysed up to date market prices for 1350 UK postcode districts and created this handy guide to the best places for buy-to-let investors in the UK, looking at rental yields for all of the locations we have data for.
Editor’s Note: There is an updated version of this data available, please see our rental yield map for 2023.
Top 25 UK Postcode Regions By Yield
| Position | Postcode | Area | Avg asking price | Sales per month | Avg asking rent (pm) | Avg yield |
|---|---|---|---|---|---|---|
| 1 | NG7 | Nottingham | 170,278 | 10 | 1,598 | 11.30% |
| 2 | NG1 | Nottingham | 159,083 | 5 | 1,473 | 11.10% |
| 3 | BD1 | Bradford | 54,526 | 8 | 483 | 10.60% |
| 4 | M14 | Manchester | 205,102 | 10 | 1,721 | 10.10% |
| 5 | NE6 | Newcastle Upon Tyne | 134,641 | 21 | 1,104 | 9.80% |
| 6 | YO10 | Yorkshire | 286,470 | 12 | 2,328 | 9.80% |
| 7 | SA1 | Swansea | 140,001 | 21 | 1,073 | 9.20% |
| 8 | CF37 | Cardiff | 135,985 | 20 | 1,039 | 9.20% |
| 9 | SO17 | Southampton | 223,073 | 6 | 1,709 | 9.20% |
| 10 | YO31 | Yorkshire | 281,391 | 20 | 2,141 | 9.10% |
| 11 | NR5 | Norwich | 261,284 | 12 | 1,934 | 8.90% |
| 12 | SR1 | Sunderland | 74,502 | 2 | 542 | 8.70% |
| 13 | LS2 | Leeds | 153,957 | 2 | 1,078 | 8.40% |
| 14 | LS4 | Leeds | 203,493 | 6 | 1,364 | 8.00% |
| 15 | CF24 | Cardiff | 211,417 | 18 | 1,397 | 7.90% |
| 16 | NE2 | Newcastle Upon Tyne | 210,053 | 15 | 1,377 | 7.90% |
| 17 | SO14 | Southampton | 204,877 | 16 | 1,347 | 7.90% |
| 18 | TR11 | Truro | 354,248 | 20 | 2,316 | 7.80% |
| 19 | B29 | Birmingham | 234,974 | 16 | 1,507 | 7.70% |
| 20 | DN31 | Doncaster | 76,659 | 5 | 490 | 7.70% |
| 21 | NE1 | Newcastle Upon Tyne | 151,639 | 5 | 968 | 7.70% |
| 22 | SA2 | Swansea | 265,882 | 23 | 1,706 | 7.70% |
| 23 | G5 | Glasgow | 150,185 | 4 | 961 | 7.70% |
| 24 | G67 | Glasgow | 78,920 | 5 | 506 | 7.70% |
| 25 | AB11 | Aberdeen | 95,319 | 9 | 596 | 7.50% |
Worst 25 Postcodes By Yield
| Poistion | Postcode | Area | Avg asking price | Sales per month | Avg asking rent (pm) | Avg yield % |
|---|---|---|---|---|---|---|
| 1 | GU10 | Guildford | 675,577 | 19 | 1,075 | 1.9 |
| 2 | HP9 | Hemel Hempstead | 1,173,312 | 15 | 1,944 | 2 |
| 3 | IG4 | Ilford | 659,997 | 3 | 1,112 | 2 |
| 4 | WD7 | Watford | 817,952 | 10 | 1,451 | 2.1 |
| 5 | CM4 | Chelmsford | 685,863 | 11 | 1,257 | 2.2 |
| 6 | B93 | Birmingham | 572,043 | 16 | 1,036 | 2.2 |
| 7 | AL4 | St Albans | 630,017 | 14 | 1,181 | 2.2 |
| 8 | KT13 | Kingston | 680,956 | 22 | 1,330 | 2.3 |
| 9 | W1 | London | 2,050,988 | 13 | 3,889 | 2.3 |
| 10 | SL9 | Slough | 851,315 | 11 | 1,708 | 2.4 |
| 11 | SL0 | Slough | 545,368 | 7 | 1,112 | 2.4 |
| 12 | GU6 | Guildford | 580,059 | 15 | 1,158 | 2.4 |
| 13 | SW3 | London | 1,790,064 | 15 | 3,532 | 2.4 |
| 14 | WR2 | Worcester | 305,920 | 19 | 611 | 2.4 |
| 15 | EX10 | Exeter | 414,458 | 17 | 833 | 2.4 |
| 16 | SG3 | Stevenage | 505,983 | 8 | 1,062 | 2.5 |
| 17 | RH13 | Redhill | 465,458 | 24 | 965 | 2.5 |
| 18 | GL53 | Gloucester | 530,747 | 14 | 1,104 | 2.5 |
| 19 | SW13 | London | 1,160,781 | 12 | 2,423 | 2.5 |
| 20 | CM24 | Chelmsford | 493,420 | 9 | 1,022 | 2.5 |
| 21 | GU32 | Guildford | 491,177 | 5 | 1,026 | 2.5 |
| 22 | LS29 | Leeds | 382,220 | 31 | 789 | 2.5 |
| 23 | SY4 | Shrewsbury | 322,802 | 15 | 663 | 2.5 |
| 24 | NW11 | London | 890,463 | 16 | 1,822 | 2.5 |
| 25 | N6 | London | 757,583 | 16 | 1,637 | 2.6 |
Unsurprisingly we see the opposite pattern with the worst performing rental yields, the south of England, specifically london and the commuter belt where house prices are generally much higher than the rest of the country, making up all but a couple of the postcodes.
The North - Top 20 Postcodes By Yield
| Position | Postcode | Area | Avg asking price | Sales per month | Avg asking rent (pm) | Avg yield % |
|---|---|---|---|---|---|---|
| 1 | BD1 | Bradford | 54,526 | 8 | 476 | 10.5 |
| 2 | M14 | Manchester | 205,452 | 10 | 1,736 | 10.1 |
| 3 | NE6 | Newcastle Upon Tyne | 135,345 | 21 | 1,106 | 9.8 |
| 4 | YO10 | Yorkshire | 286,440 | 12 | 2,275 | 9.5 |
| 5 | YO31 | Yorkshire | 281,579 | 20 | 2,199 | 9.4 |
| 6 | SR1 | Sunderland | 74,502 | 2 | 537 | 8.6 |
| 7 | LS2 | Leeds | 155,334 | 2 | 1,062 | 8.2 |
| 8 | LS4 | Leeds | 203,493 | 6 | 1,342 | 7.9 |
| 9 | NE2 | Newcastle Upon Tyne | 210,053 | 15 | 1,358 | 7.8 |
| 10 | NE1 | Newcastle Upon Tyne | 151,813 | 5 | 965 | 7.6 |
| 11 | TS1 | Middlesbrough | 68,119 | 7 | 420 | 7.4 |
| 12 | TS3 | Middlesbrough | 81,914 | 10 | 501 | 7.3 |
| 13 | NE4 | Newcastle Upon Tyne | 129,478 | 6 | 765 | 7.1 |
| 14 | LA1 | Lancaster | 166,462 | 27 | 952 | 6.9 |
| 15 | L15 | Liverpool | 170,150 | 12 | 971 | 6.9 |
| 16 | L4 | Liverpool | 106,086 | 15 | 605 | 6.8 |
| 17 | LS6 | Leeds | 242,456 | 16 | 1,370 | 6.8 |
| 18 | TS4 | Middlesbrough | 105,217 | 7 | 569 | 6.5 |
| 19 | M13 | Manchester | 216,963 | 2 | 1,175 | 6.5 |
| 20 | DL4 | Darlington | 74,148 | 6 | 394 | 6.4 |
Each of the top 20 northern postcodes return much higher yields than the national average of 3.63%, with the top 10 postcodes easily doubling that return. Bradford’s BD1 postcode benefits from having a very low average asking price with properties regularly selling for below £50,000, it’s clear then that strong returns can be generated from the north’s cities.
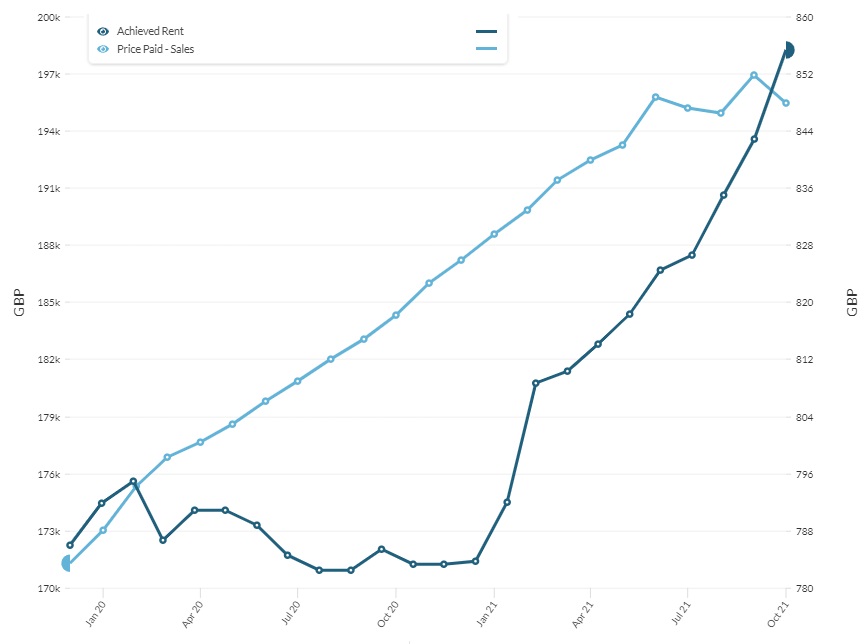
Manchester
In recent years Manchester’s property market has grown at a promising rate, with achieved rent growing along with an increase in property prices. Investors aren’t short of options when it comes to where they put their money in the city, with new development projects being constructed and completed at an impressive rate and around 100,000 students in the city at any given (term) time. The M14 postcode, popular with students, is one of the best performing in the country. This city might be one of the most attractive prospects for property investment anywhere in the UK.
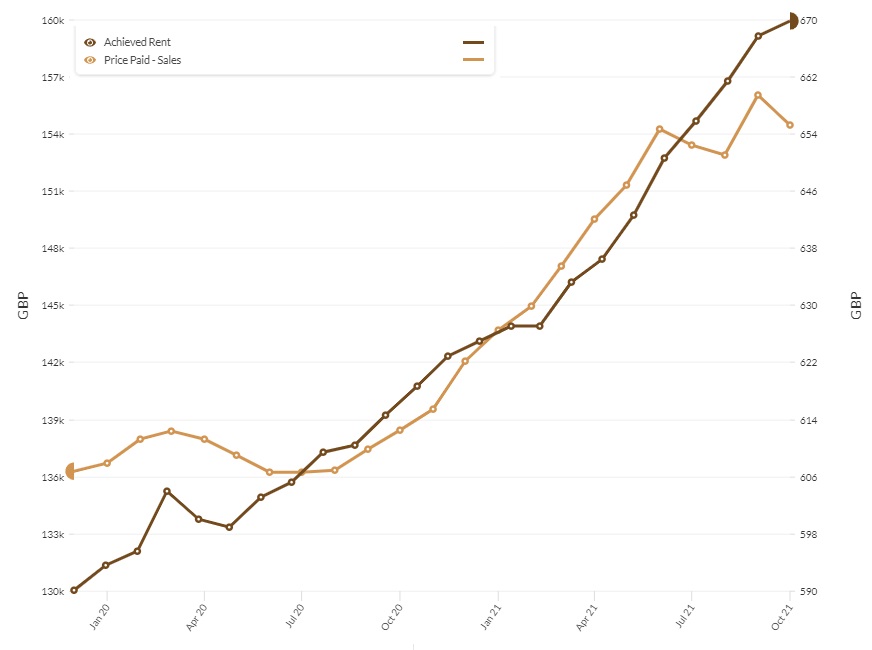
Liverpool
Liverpool has been recognised in recent years as the number one place in the UK for investors seeking to maximise yields, driven by affordable property prices throughout the city and higher than average yields, with the L15 and L4 postcodes reaching an average of 6.9% and 6.8% respectively. Liverpool is a city that, whilst steeped in history, is embracing modernisation, including a plan to invest billions in the redevelopment of its historic waterfront.
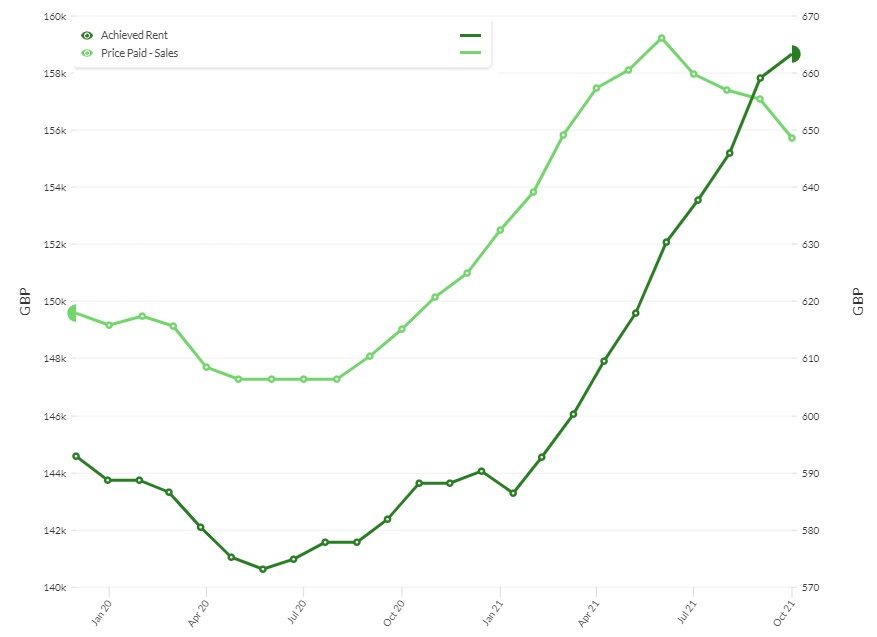
Newcastle-Upon-Tyne
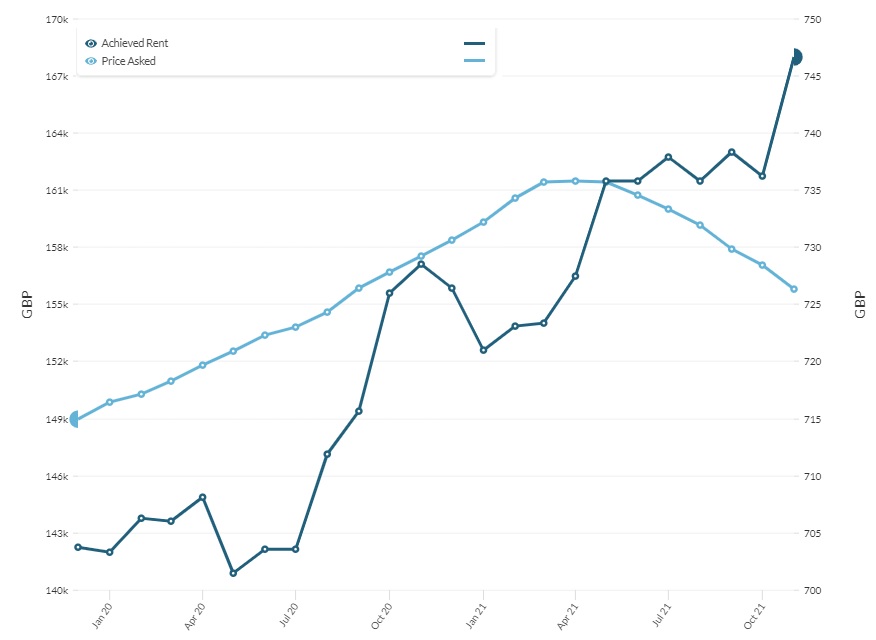
Another bustling city with industrial heritage, Newcastle is now a popular hub for business and education. Featuring strongly on the best buy-to-let areas, 3 of the city’s postcodes are in the top 25, with impressive yields of up to 9.8%. A slight decline in house prices and an upward trend in rental prices may indicate that now is an ideal time to consider investing in Newcastle.
London’s 10 Best Postcodes By Yield
| Position | Postcode | Area | Avg asking price | Sales per month | Avg asking rent (pm) | Avg yield % |
|---|---|---|---|---|---|---|
| 1 | DA9 | Dartford | 274,808 | 10 | 1,193 | 5.2 |
| 2 | RM19 | Romford | 217,580 | 5 | 927 | 5.1 |
| 3 | IG11 | Ilford | 329,241 | 15 | 1,375 | 5 |
| 4 | RM8 | Romford | 343,608 | 9 | 1,419 | 5 |
| 5 | SE17 | London | 515,062 | 10 | 2,076 | 4.8 |
| 6 | SE28 | London | 306,806 | 6 | 1,221 | 4.8 |
| 7 | RM9 | Romford | 350,135 | 12 | 1,397 | 4.8 |
| 8 | N9 | London | 356,925 | 12 | 1,390 | 4.7 |
| 9 | RM10 | Romford | 354,070 | 13 | 1,397 | 4.7 |
| 10 | TW20 | Twickenham | 454,993 | 15 | 1,788 | 4.7 |
Not without its merits, London and its immediate surrounding areas may not be the best place to look for those seeking the maximum rental yields, however, above-average returns can still be realised in and around the city.
Each of these may return some satisfactory yields if you factor in average property values in these areas. The best yields are to be found a little further out in the areas of Dartford and Romford, places still within commuting distance to the city.
London’s 10 Worst Postcodes By Yield
| Position | Postcode | Area | Avg asking price | Sales per month | Avg asking rent (pm) | Avg yield % |
|---|---|---|---|---|---|---|
| 1 | IG4 | Ilford | 659,997 | 3 | 1,112 | 2 |
| 2 | WD7 | Watford | 817,952 | 10 | 1,451 | 2.1 |
| 3 | W1 | London | 2,050,988 | 13 | 3,889 | 2.3 |
| 4 | KT13 | Kingston | 680,956 | 22 | 1,330 | 2.3 |
| 5 | SW3 | London | 1,790,064 | 15 | 3,532 | 2.4 |
| 6 | NW11 | London | 890,463 | 16 | 1,822 | 2.5 |
| 7 | SW13 | London | 1,160,781 | 12 | 2,423 | 2.5 |
| 8 | N6 | London | 757,583 | 16 | 1,637 | 2.6 |
| 9 | SW10 | London | 1,293,918 | 12 | 2,806 | 2.6 |
| 10 | SW5 | London | 1,038,567 | 8 | 2,328 | 2.7 |
On the flip side, we will take a look at Londons worst-performing postcodes. It’s no surprise to see some of the more expensive postcodes in London on this list, where even a much higher than average rent barely makes a dent in the asking price of a property.
Wales - Top 10 Postcodes By Yield
| Position | Postcode | Area | Avg asking price | Sales per month | Avg asking rent (pm) | Avg yield % |
|---|---|---|---|---|---|---|
| 1 | CF37 | Cardiff | 136,008 | 20 | 1,057 | 9.3 |
| 2 | SA1 | Swansea | 140,001 | 21 | 1,071 | 9.2 |
| 3 | CF24 | Cardiff | 211,863 | 18 | 1,422 | 8.1 |
| 4 | SA2 | Swansea | 266,231 | 23 | 1,713 | 7.7 |
| 5 | CF10 | Cardiff | 179,271 | 7 | 1,062 | 7.1 |
| 6 | LL57 | Llandudno | 182,895 | 10 | 966 | 6.3 |
| 7 | CH41 | Chester | 107,960 | 9 | 547 | 6.1 |
| 8 | NP13 | Newport | 116,670 | 12 | 567 | 5.8 |
| 9 | CF48 | Cardiff | 135,141 | 10 | 611 | 5.4 |
| 10 | CH65 | Chester | 149,454 | 13 | 643 | 5.2 |
Glancing over the border into Wales we take a look at their most profitable buy-to-let properties. Now then, for the purposes of this report, the CH postcode of Chester, Merseyside and North East Wales is included under the banner of Wales, as this area still provides some promising buy-to-let opportunities that would be missed if solely grouped in with the north of England.
It Looks however like the Welsh capital, Cardiff, and the city of Swansea share 60% of the top 10 postcodes in Wales, including each of the top 5 spots. Asking rents that can typically be expected of a UK capital city, combined with affordable property prices indicate that Cardiff could be worth serious consideration in the future.
Worst 10 Postcodes For Yields In Wales
| Position | Postcode | Area | Avg asking price | Sales per month | Avg asking rent (pm) | Avg yield % |
|---|---|---|---|---|---|---|
| 1 | NP25 | Newport | 338,619 | 10 | 748 | 2.7 |
| 2 | CF64 | Cardiff | 360,629 | 27 | 933 | 3.1 |
| 3 | LL13 | Llandudno | 189,119 | 16 | 564 | 3.6 |
| 4 | CF23 | Cardiff | 302,147 | 22 | 953 | 3.8 |
| 5 | CF72 | Cardiff | 271,362 | 22 | 858 | 3.8 |
| 6 | LL11 | Llandudno | 185,979 | 21 | 611 | 3.9 |
| 7 | SY23 | Ceredigion | 234,946 | 16 | 755 | 3.9 |
| 8 | CF31 | Cardiff | 212,763 | 23 | 709 | 4 |
| 9 | LL18 | Llandudno | 173,930 | 20 | 588 | 4.1 |
| 10 | NP20 | Newport | 199,505 | 22 | 690 | 4.1 |
Much like the other “worst postcodes” data we have, the property prices found in these locations ensure that yields are low, however, some of these are popular tourist areas where high prices are to be expected and rental income can be seasonal, for example, LL18 covers the very popular tourist town of Rhyl and SY23 includes Aberystwyth.
Scotland - 10 Best Postcodes By Rental Yield
| Position | Postcode | Area | Avg asking price | Sales per month | Avg asking rent (pm) | Avg yield % |
|---|---|---|---|---|---|---|
| 1 | G5 | Glasgow | 150,185 | 4 | 961 | 7.7 |
| 2 | G67 | Glasgow | 78,920 | 5 | 506 | 7.7 |
| 3 | G32 | Glasgow | 96,052 | 7 | 600 | 7.5 |
| 4 | AB11 | Aberdeen | 95,319 | 9 | 596 | 7.5 |
| 5 | G14 | Glasgow | 108,625 | 8 | 672 | 7.4 |
| 6 | PA1 | Paisley | 96,948 | 6 | 564 | 7 |
| 7 | AB24 | Aberdeen | 105,712 | 10 | 601 | 6.8 |
| 8 | DD4 | Dundee | 117,132 | 10 | 643 | 6.6 |
| 9 | G31 | Glasgow | 132,249 | 7 | 718 | 6.5 |
| 10 | G2 | Glasgow | 174,052 | 2 | 925 | 6.4 |
North of the border into Scotland, it’s easy to focus on investment opportunities in either Edinburgh or Glasgow, but what does the data show us? Where are the areas that could potentially deliver the best returns?
Well, it seems that if you want to see the highest return on investment for a rental property in Scotland there are fewer better places to look than Glasgow. Aberdeen’s AB11 postcode sneaks in amongst Glasgow with an impressive 7.5% yield. We can also see that there are on average more property sales per month in cities outside Glasgow, perhaps making them easier markets to enter, with more choice for investors.
Worst Postcodes In Scotland By Yield
| Postcode | Area | Avg asking price | Sales per month | Avg asking rent (pm) | Avg yield |
|---|---|---|---|---|---|
| G84 | Glasgow | 217,878 | 7 | 639 | 3.5 |
| KA3 | Kilmarnock | 160,030 | 7 | 481 | 3.6 |
| EH10 | Edinburgh | 364,537 | 7 | 1,112 | 3.7 |
| DD2 | Dundee | 204,500 | 9 | 651 | 3.8 |
| PH2 | Perth | 185,328 | 11 | 606 | 3.9 |
| AB15 | Aberdeen | 278,482 | 13 | 900 | 3.9 |
| IV2 | Inverness | 217,643 | 14 | 708 | 3.9 |
| EH12 | Edinburgh | 313,919 | 8 | 1,043 | 4 |
| EH3 | Edinburgh | 407,795 | 12 | 1,364 | 4 |
| PH1 | Perth | 161,937 | 15 | 535 | 4 |
On the opposite end of the scale we see results spread out across the country a little more, with Edinburgh featuring more than any other area. High property prices in some areas of the Scottish capital keep the figure low, although the city is a draw to many tourists and students alike.
Conclusion
This data has shown that there are some very promising areas through the UK for property investment. The north of England remains strong for delivering consistent high yields, balancing property prices, rising rents and steady demand. Above 7% yields are possible in the northern cities of Manchester, Liverpool, Leeds and Newcastle.
Data from properties in London will naturally show lower yields, however, there are still opportunities present in the Greater London area, where prices are slightly lower than the city centre driven by demand from commuters.
For an in-depth guide to beginning your property investment journey please check out our Ultimate Guide To Property Investment, and for more information or advice on property investment feel free to fill in the contact form below – we’d be happy to answer any questions.
About the data
We analysed UK rental yield and property price data from 1350 postcode areas. This data was provided by propertydata.co.uk and graphs were produced using data from REalyse.